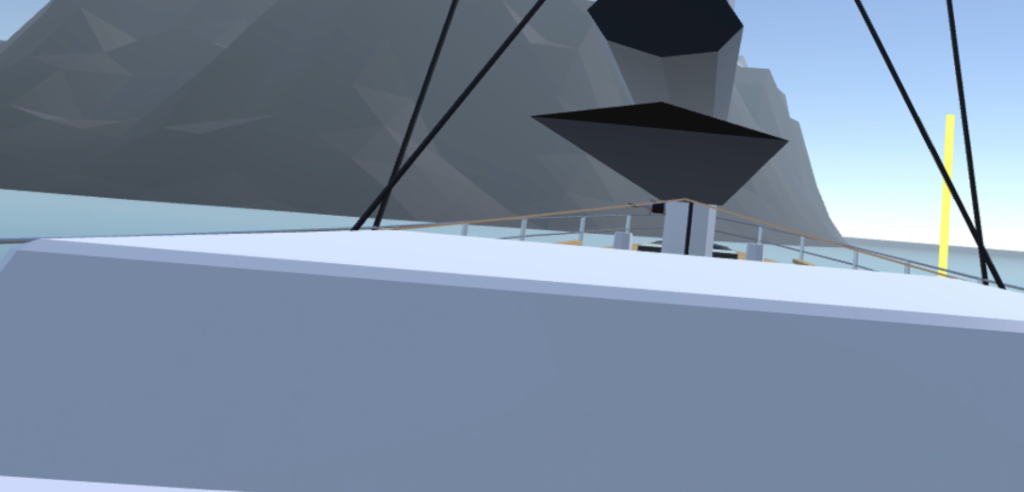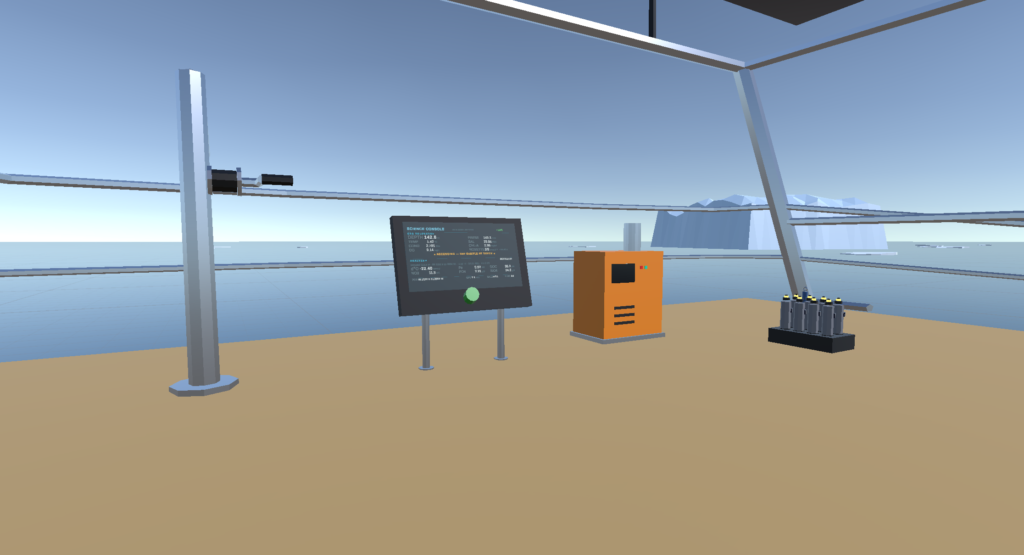
Gracial Retreat VR, Greeenland
1. Sandbox Mode
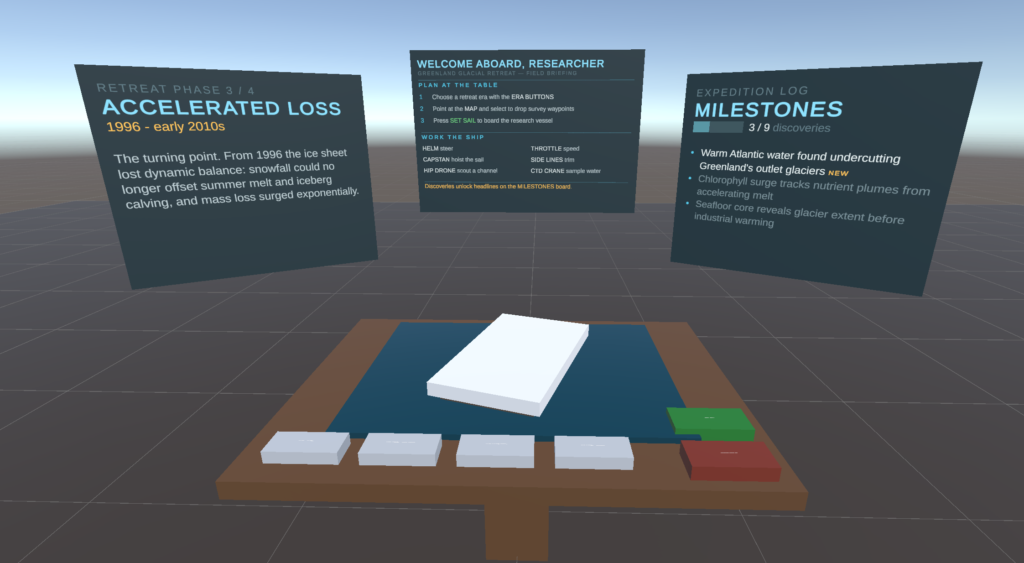
(1) Desktop diorama (sandtable)
① An adjustable, phase-based prototype — referring to “3. Retreat Phases”, it visualizes the degree of Greenland glacial retreat
② Set survey waypoints and plan the voyage; the goal is to collect as much water and biological information as possible, with each type of information unlocking corresponding news achievements.
(2) Milestone system
① Updated according to the player’s scientific discovery progress in the embodied mode
2. Embodied mode
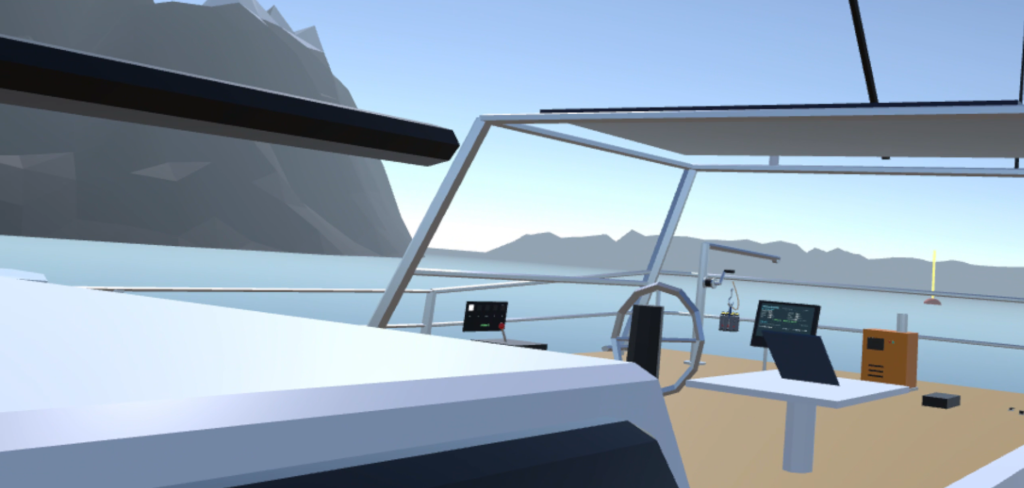
(1) Module 1: Physical Helm Wheel and Power Control (The Cockpit Layer)
① VR interaction: the player reaches out both hands in virtual space and physically grabs the large helm wheel at 1:1 scale; when turning the wheel, the controllers provide nuanced haptic feedback that simulates the resistance of water flow against the rudder blade.
② Power adjustment: a mechanical throttle lever is designed on the right-hand side. When sudden drift ice appears, the player must quickly put the helm hard over with the left hand and push the throttle up with the right hand to complete an emergency evasion.
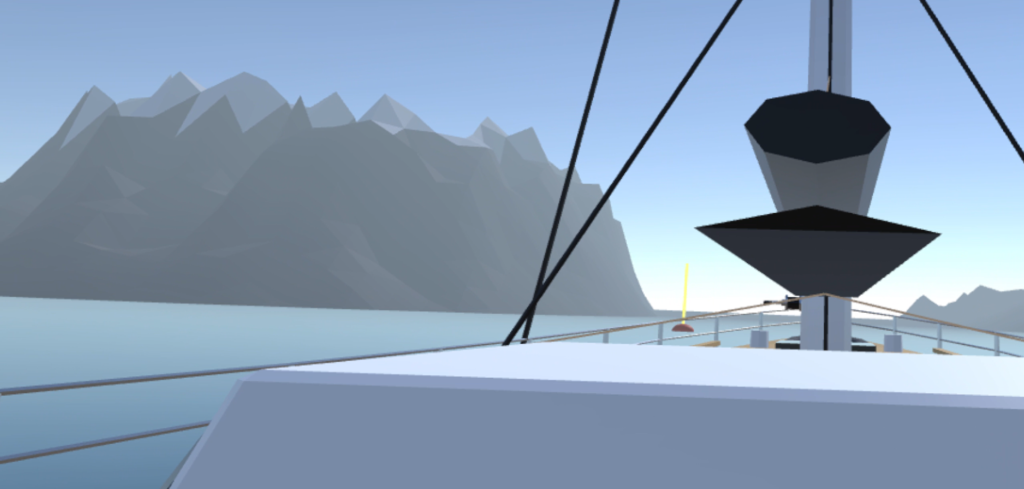
(2) Module 2: Manual Capstan and Sail Line Handling (Rigging Layer)
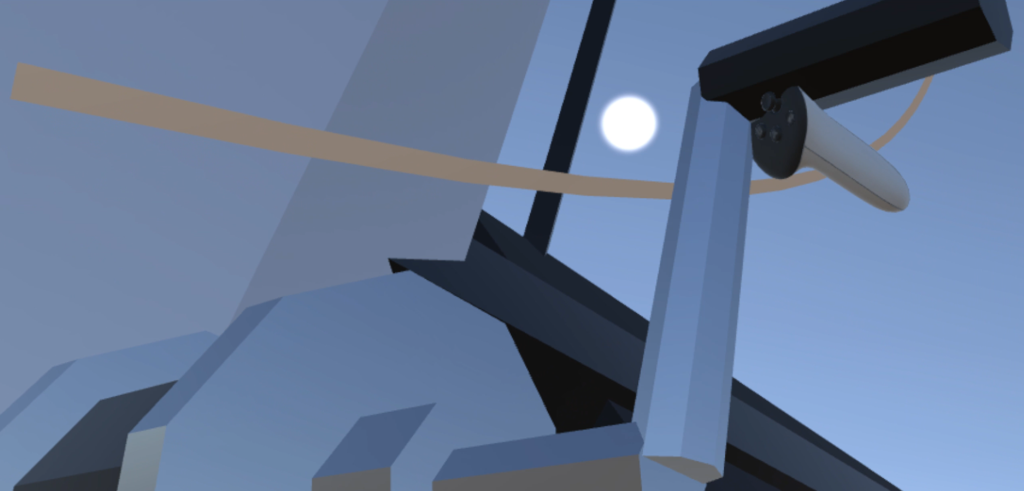
① VR interaction: when it is time to hoist the sails for speed, the player must perform a multi-step interaction — physically pick up the colored ropes from the deck (see reference image), wind them clockwise around the capstan, insert the crank handle, and alternate both hands in a circular “windmill” motion to tension the sails.
② Strong-wind zone — lower the mainsail and start the combustion engine
③ Sustained-wind zone — adjust the lines on both sides of the hull to change the sail angle for more speed
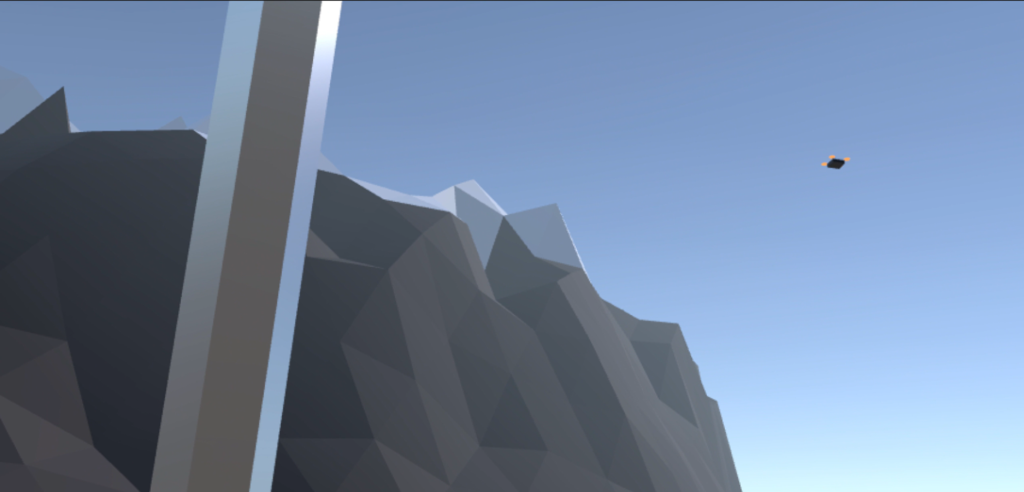
(3) Module 3: Drone Ice-Sea Scouting (Drone Scouting Layer)
① VR interaction: when the radar alarm sounds and the view ahead is blocked by a giant iceberg, the player can take the virtual remote controller from the hip holster. The player’s view instantly switches to the drone’s first-person view (FPV) or a picture-in-picture UI, flying the drone over the Greenland glaciers and marking a safe channel through the complex ice sea for the sailboat with fluorescent route markers.
(4) Module 4: Biogeochemical Sampling Missions (Science Sampling Layer)
① VR interaction: a faithful recreation of the scene. The game switches to a scientific-research side activity: the player puts on virtual blue sterile rubber gloves, operates the mini davit winch at the stern, and slowly lowers a plastic sampling bag or CTD array into the polar-green seawater, watching the salinity and chlorophyll readings tick on the instrument panel.
② Seawater sample extraction: dissolved composition, isotope analysis
③ CTD profiling of the water column: temperature, salinity, chlorophyll, oxygen content, etc.
④ Seafloor sediment core extraction, plankton capture
3. Background — Retreat Phases
(1) Phase 1: Slow Response in the Early Industrial Era (1900 – 1970s)
① With the accumulation of greenhouse gas emissions after the Industrial Revolution, the Greenland glaciers ended their “Little Ice Age” growth and began their first retreat in response to climate warming, though at a relatively slow and fluctuating pace.
(1) Phase 2: The North Atlantic “Cold Spot” and Plateau (late 1970s – early 1990s)
① During this stage, the Greenland glaciers were in a relatively stable plateau; some southern regions even experienced brief cooling and increased snowfall, mainly due to local variations in the North Atlantic currents.
(2) Phase 3: Total Imbalance and Accelerated Melt (1996 – early 2010s)
① This was a turning point. From 1996 onward, the Greenland ice sheet completely lost its dynamic balance: snowfall could no longer compensate for summer melt and iceberg calving, and the rate of loss escalated exponentially.
(3) Phase 4: Extremification and the Brink of “Irreversibility” (mid-2010s – present)
① After entering this phase, Greenland’s melting has evolved from a “seasonal event” into a “normalized and extreme” pattern. Even under the assumption of reduced greenhouse gas emissions, the glacier retreat has already been “locked in”.
4. Sampling / Science
CTD Rosette
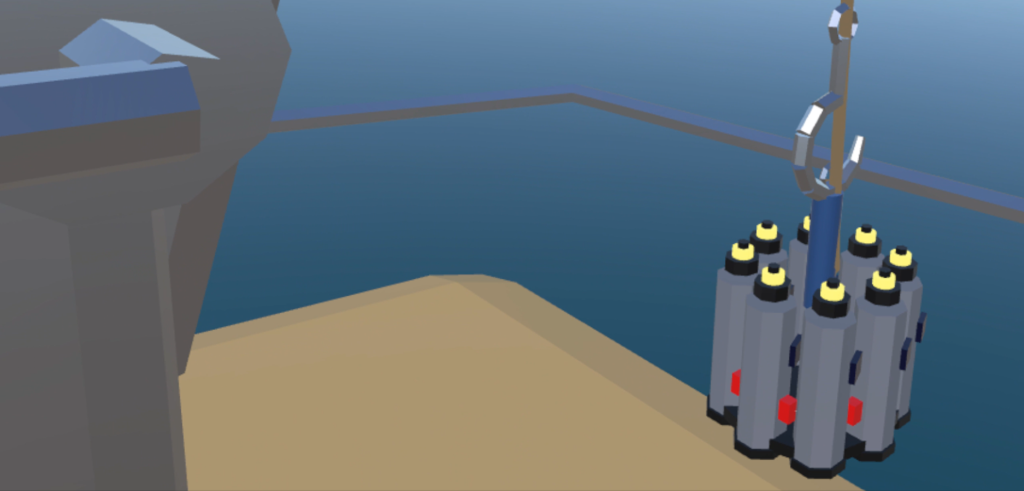
① Main components of the “CTD Rosette”
1) “Niskin Bottles” (cylindrical body, top cap, bottom cap)
2) “CTD Sensors” (mounted on the Rosette Frame)
3) “Rosette Frame” (8 slots)
② Interaction flow
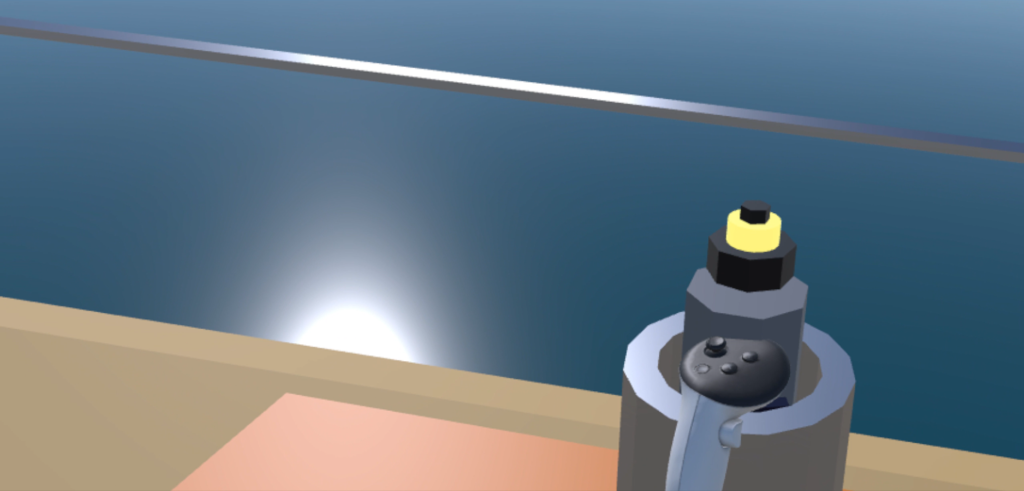
1) Take a “Niskin Bottle” out of the “Niskin Bottles Box” and place it into the Rosette Frame (8 slots) of the “CTD Rosette”, repeating until all slots are filled.
2) Open the top and bottom caps of each “Niskin Bottle” so that it is in an open, flow-through state.
3) Mount the entire “Niskin CTD rosette carousel” onto the “CtdCarriage”.
4) The player turns the “Winch” to send the entire “CTD Rosette” down into the deep sea.
5) The “Science Console” displays real-time data
- a. Conductivity (used to derive salinity)
- b. Temperature
- c. Chlorophyll fluorescence intensity
- d. Dissolved oxygen (DO)
6) The “CTD Rosette” bottoms out, and the “Science Console” indicates that the bottom has been reached.
7) The player turns the “Winch” and the “CtdCarriage” begins to ascend.
8) When a sampling depth is reached, the player clicks the sampling button on the “Science Console”, and the top and bottom caps of one unused “Niskin Bottle” underwater snap shut instantly.
9) Stepwise operation: the player turns the “Winch”, the “CtdCarriage” continues to ascend, hovering at different depths to trigger the remaining “Niskin Bottles” in sequence, until the device returns to the surface.
10) Detach the “CTD Rosette” and place it at the corresponding position on the deck.
11) Take a “Niskin Bottle” out of the “CTD Rosette” and place it into the “Analyzer”; the analysis results are shown on the “Science Console” panel.
③ Recorded data
1) During sampling, the “Science Console” displays CTD monitoring metrics:
- a. Depth
- b. Pressure
- c. Conductivity (used to derive salinity)
- d. Temperature
- e. Chlorophyll fluorescence intensity
- f. Dissolved oxygen (DO).
2) “Niskin Bottles” water sample data: after placing the bottle into the “Analyzer”, the “Science Console” displays:
- a. Organic particles (nutrients: nitrogen, phosphorus, silicon)
- b. Inorganic particles (e.g., bioavailable iron)
- c. Dissolved organic carbon (DOC)
5. Drone
A controllable drone; drone interaction design (when held in hand)
① Left stick controls movement
② Right-hand A / B buttons control ascent and descent
③ Right stick controls the drone camera
6. Diorama Map & Real-Scene Map
ART: the map differs across the four phases, with different unlockable channels and different landscapes
7. Geographic Information Map
① Conductivity (used to derive salinity) + Temperature
- 1) “Warm and salty” water layer — the warm Atlantic current is intruding into the Greenland fjords:
- 2) “Cold and fresh” water layer — polar glacial meltwater flow.
② The peak position of chlorophyll fluorescence intensity — the zone where phytoplankton is densest, which determines the fishery yield and carbon sink capacity of this sea area for the season.
③ Dissolved oxygen (DO).
④ Stable isotope ratio of — yields the proportion of glacial meltwater in the seawater.
⑤ Organic particles (nutrients: nitrogen, phosphorus, silicon)
⑥ Inorganic particles (e.g., bioavailable iron )
⑦ Dissolved organic carbon (DOC)